WUHAN VIRUS DAILY UPDATE FOR APRIL 27
CURVES DOWN - SUPPRESSION OF SCIENTIFIC DEBATE WAY WAY UP. As we completely expected, the typical weekend malaise of data collection has the numbers coming in lower on all counts. Meanwhile, the most egregious act of information suppression I have ever seen from Google just occured on Facebook with the removal of the original video I linked to in my earlier blog entry. I will be posting another entry about the kind of attitude that it takes to do this and an example of how even otherwise perfectly reasonable and smart people can fall prey to this. It's incredibly dangerous and the most Anti-American thing I can imagine. This is sending Japanese to concentration camps Anti-American people. But enough of the moral dilema, and on to the questionable stats...
Our new total for incidents is 981,134 (+22,078 - righ on track for the 1Million on Apr 28th prediction by Adam Nyback), an increase of 2.30% over the previous day (-0.63% from yesterday). Deaths have totaled 50,327 (+1,163) which is an increase of %2.37. (-0.10%) over the previous day. Since the peak in Mar 19, rates of growth for incidents has fallen by 49.33% and for deaths has fallen by 40.49%. Frustratingly, but hopefully just a data capture latency issue, we only processed 141,980 tests back down to our prior 150k daily average.
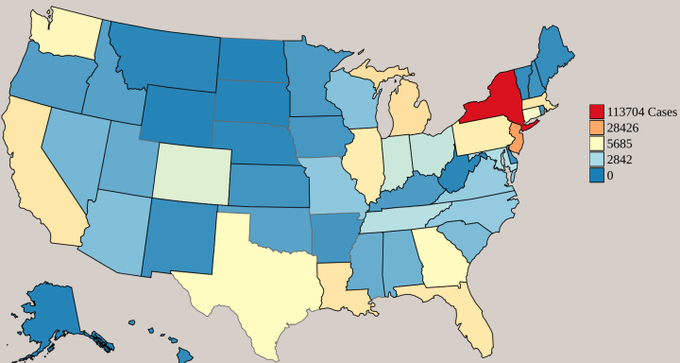
Another interesting site that I discovered today is http://covidtrace.info/ which uses the same data source that I do. Their USA map really shows how this is a NYC/NJ phenonmenon for the most part. However, take the USA map with a grain of salt as it's based on raw numbers and not per-capita numbers. Once you switch to per-capita you're going to see that the Wuhan-virus does impact a significant number of our communities in a very real way. Just not anything even remotely as much as NYC.