WUHAN VIRUS DAILY UPDATE FOR APRIL 30
SLOW DOWN TREND DESPITE "TRUING UP" OF DATA. Try as hospital administrators and quasi-government officials like, the trend is down. Unfortunately all the data manipulation makes it pretty much impossible to get any projective value from it. The pandemic remains a phenomenon restricted to high density populations or populations particularly at risk - the obese, sick, or Native Americans. As those areas decline, so goes the curve. There have not been the feared surge of new secondary curves from other hot spots. Yes other big cities have increased their numbers but these cities don't have anywhere close to the population densities of NYC. For example, New York City has a population density of 27,814 per km2. LA: 3,275, SF: 1,440, and ATL: 1,299. We're just not even in the same order of magnitude and the relationship between pop density and virus deaths seems to be super linear beyond some point that is between those two extremes. The rest of America has something like Nashville's 465/km2 or lower - much lower.
Another phenomenon that's been driving the numbers up - government pork. Don't believe me? Explain this chart showing the differences in deaths in NYC for Mid-March - Mid-April in 2019 and 2020:
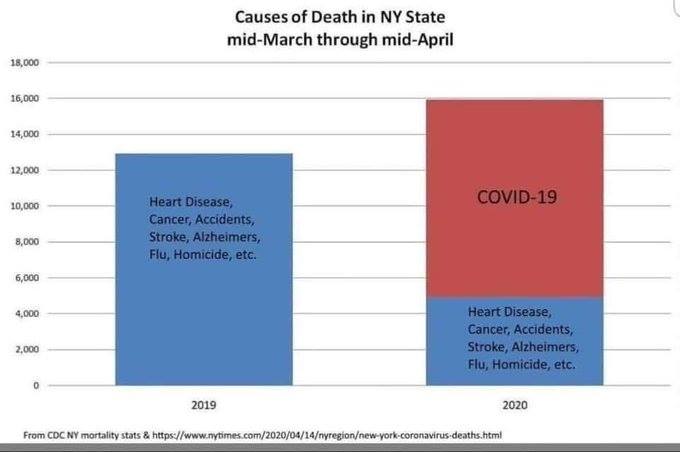
Clearly there are significantly more deaths. Also clearly, at least 2/3rds of the total were NOT caused by Wuhan-virus. There's just no way of coming to any other conclusion when you look at the data. Understand that this is NOT a political report. It's an attempt to analyze the data and see how it explains the phenonmenon of this pandemic. When the data goes against the narrative we are forced to re-examine both closely and then make adjustments that are supported by objective fact.
Watch this video from the Illinois Director of Public Health spelling out precisely that the reports of "Covid deaths" absolutely include anyone who has died from any reason whatsoever but tested positive. She describes terminal patients who didn't have Wuhan-virus but then test positive and DID NOT die as a result of any Wuhan-virus related cause - "WILL BE COUNTED AS A COVID DEATH". This is happening across America and it's incredibly unethical yet they don't even pretend to hide it.
Arguments have been made that the numbers are only low because of the shutdown. Well the evidence doesn't support this either. California, praised for their leadership and sacrifice - about 5 deaths per 100k population. Florida & Texas, condemned for their gross irresponsibility - FL: 6/100k, TX: 3/100k. There's only a 5% correlation between places shutdown vs places not shutdown on their death rates. This is statistically insignificant because it's right at the margin of error boundary.
Sweden, infamous for going straight down the herd immunity path, would place somewhere around 8th in US states and near the middle for European nations as reported by T.J. Rodgers, founder of Cypress Semiconductor. However, population density correlates 40% to deaths. So there is zero justification for shutting down 90% of America based on the data that everyone has.
So this is why it's difficult to make any useful projections from the data. The goal posts keep getting moved to fit the narrative instead of the other way around. So what's the score card saying today?
Our new total for incidents is 1,061,101 (+27,944), an increase of 2.70% over the previous day (-0.04% from yesterday). Deaths have totaled 57,266 (+2,041) which is an increase of %3.70 (-1.44%) over the previous day. Since the peak in Mar 19, rates of growth for incidents has fallen by 48.93% and for deaths has fallen by 39.16%. Frustratingly, we still only have 202,955 tests processed when were were expecting significantly higher capacity.
Who knows what tomorrow brings?