WUHAN VIRUS DAILY UPDATE FOR MAY 3
GOING, GOING, NOT QUITE GONE BUT DEFINITELY GOING. Everything here is caveat Sunday - that means we expect the typical weekend under reporting influences the numbers further down than in reality but, even with that qualification, the trend is only one direction - down. We'll see Tuesday just how far down that is.
Thus far, New York City and New Jersey have been 90%+ of the total deaths and completely in command of the curve. New York, despite their government efforts to pump up the numbers so they can be first in line for federal bailouts (Politics is an auction of goods about to be stolen.), is definitely about burned out and New Jersey will be soon. This is why the current curve is in decline. This decline can only accelerate downward throughout May UNLESS we get new hot spots from other areas of America. The places to watch out for have been named numerous times in our analysis and some small curves have shown up, but nothing even within the same order of magnitude as the levels from NY/NJ. This is what drove our projection on May 1 that this month will be considerably milder in terms of deaths than April was - despite any efforts to open up the country.
So how do we track this? Well fortunately there's a pretty good web site from Doug Lamb that tracks incidents and rates of growth (rog) of incidents in America nicely. The following two charts can be generated from the site.
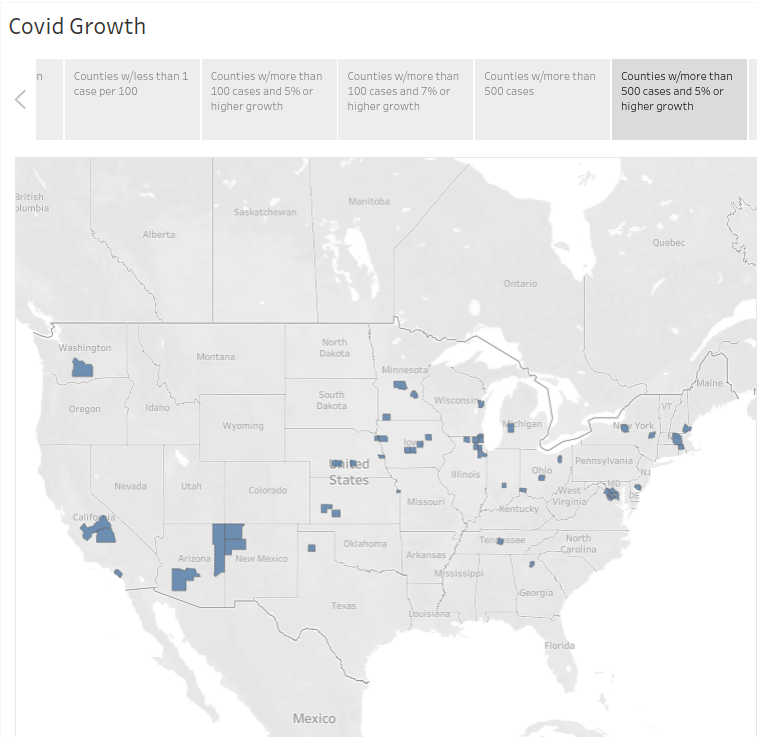
These are the areas that are increasing incidents (but not necessarily deaths) at a rate that we should be concerned about:
Potential Hotspots - Counties with > 500 cases and 5%+ ROG
These are the areas that haven't been impacted by Wuhan-virus by any possible measure:
Absolute Coldspots - Counties with < 100 total cases
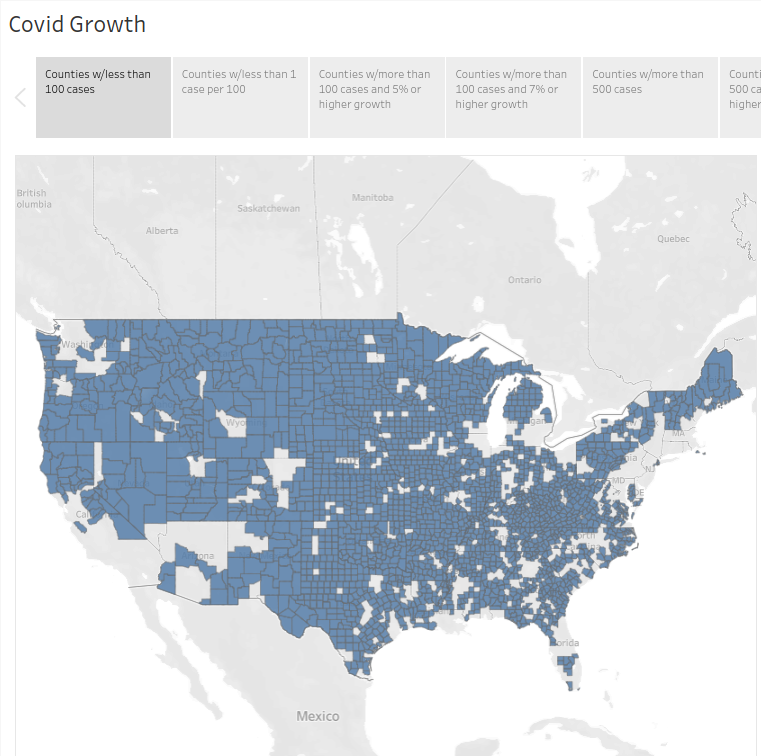
As you can see - Wuhan-virus is a highly localized phenomenon. By taking basic precautions and good personal hygine, we can keep it that way and let it burn out of the hot spots. The rest of America highlighted in the 2nd graph can absolutely get back to their otherwise normal lives. Given the current 14-day rolling average, our absolute number of deaths will drop below 1000/day by May 21. But that's assuming the curve doesn't drop faster which we have every reason to expect that it will so hopefully that goal will be achieved far sooner. If we used a 7 day moving average that event happens by May 17th.
Our new total for incidents is 1,152,006 (+26,287), an increase of 2.34% over the previous day (-0.41% from yesterday). Deaths have totaled 61,868 (+1,158) which is an increase of 1.91% (-0.89%) over the previous day. This is the LOWEST DEATH ROG yet recorded and the lowest absolute number of deaths since April 2! Since the peak in Mar 19, rates of growth for incidents has fallen by 49.30% and for deaths has fallen by 40.95%. There were 238,253 tests completed with a 11.03% positive rate. Being weekend numbers we'll need to wait til Tuesday or Wednesday to suss out any actual trend since yesterday. No unusual reports from amongst the states except we know deaths are still being padded per state mandate.
So long as no other cities start hitting death rates like NY or NJ, we will see deaths drop off rapidly this month and this whole thing will be a non-issue by June 1. Take the win.