WUHAN VIRUS DAILY UPDATE FOR MAY 11
NEW RECORD LOWS - TIL TOMORROW. Monday's have been consistently the lowest recorded days and today is no different. The next two charts spell this out clearly. We can also expect that our hospitals and local governments are scurrying around the morgues finding any bodies they can to push those counts higher even though they died of other causes.
Here's a useful comparison from Peter Walker. Light blue is NY state, rest of America is the purple. Some very clear trends going on here despite the best efforts of the death counters.
Peter Walker - New Deaths by Day 7 Day Moving Average
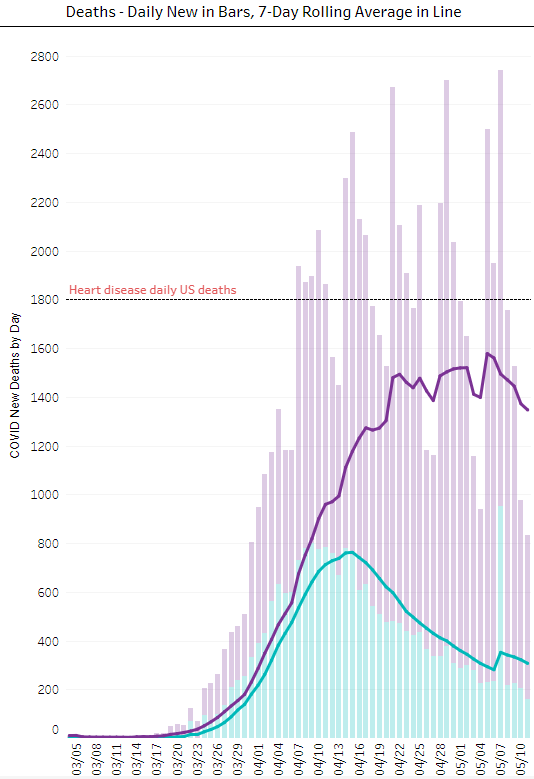
Note that Wuhan deaths are smaller than the average daily deaths from heart disease on average and dropping. Understand that the heart disease line (at 1800) is a bit misleading because the above graph breaks the totals down into two values which you need to sum together for a proper comparison. The next graph shows new deaths as a single value so note where 1800 would be and you'll see that average Wuhan counted deaths peaked about 2000 and is now below 1800.
COVID Tracking Project - U.S. Daily COVID-19 Deaths
![]()
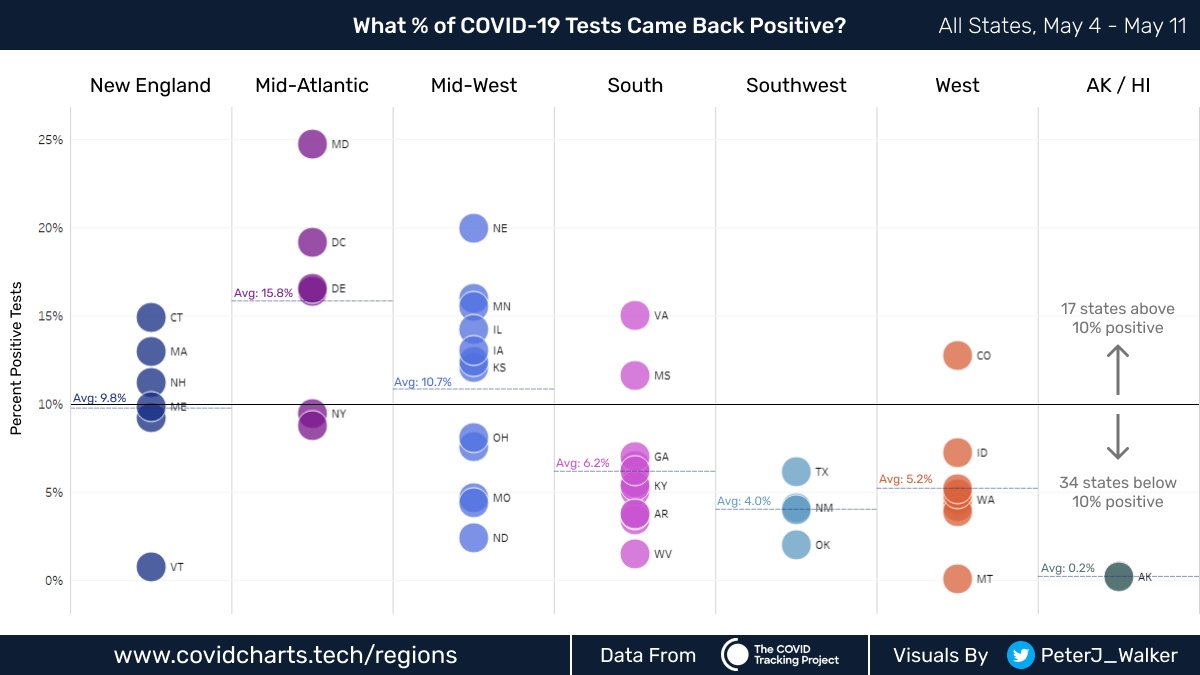
Yesterday we showed how the testing was revealing new cases in different parts of the states. The next graph provides a better break out of individual states, still grouped by region. Note that NY & NJ are together just under 10% and dropping but the rest of the Mid-Atlantic are not doing well. New England hot spots are still hot and Nebraska seems to be getting a larger ratio of new cases. The South is doing great but Virginia and Mississippi need to be watched carefully. The Southwest is fine as is the West all except Colorado as an outlier.
Peter Walker - What % of COVID-19 Tests Came Back Positive?
Note that Massachusetts has climbed up to 3rd place in most deaths and their daily totals are sticking at about 130/day. Michigan is 4th place but their rates have been dropping as are NY & NJ, numbers 1 and 2 respectively.
Our new total for incidents is 1,340,412 (+17,605), an increase of 1.33% over the previous day (-0.34% from yesterday) - a new low record, two in a row! Deaths have totaled 75,107 (+837) - another big record low - which is an increase of ONLY 1.13% (-0.21%) over the previous day. Since the peak in Mar 19, rates of growth for incidents has fallen by 50.31% and for deaths has fallen by 41.73%. There were 393,605 tests completed with a 4.47% positive rate - the lowest we've yet measured by far!
Big question is how much higher tomorrow's numbers will be so we can see if this thing is going to keep a downward curve. My expectation is that you're gonna see the death inflation backing off for two reasons, 1) they're quite literally running out of bodies to count; 2) governors are starting to feel a LOT of political pressure to open up and if they can make their death rates go down by tightening up the reporting, it will allow them to claim "victory" over the virus (due to their wonderful policies of course) and do what their citizens demand. Problem with all that is, if a 2nd wave actually comes on us, our history of inflated numbers will hide it until it gets really big. That will delay our actions and kill a lot of people if it happens. All for scoring political points and federal pork.